
Do you really want to know if your email campaigns are working? Then it’s essential to track the right email metrics. In this article, I’ll take you step-by-step through the 20 essential KPIs to monitor to maximize the impact of your emails! 📈
➡️ Contents:
- ✅ Best practices in email marketing and in relation to emailing kpis.
- 🚨 What not to do in your campaign.
- 🔝 Calculations of the most important emailing kpis and how to track them.
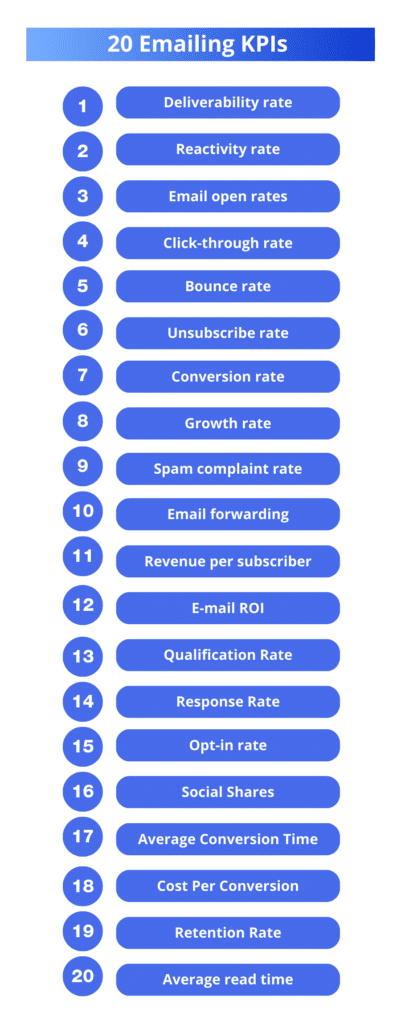
Top 20 emailing KPIs to track
To assess the performance of your email campaigns, you need to track the right KPIs. They enable you to understand what’s working (or not) in your e-mails, and above all, to adjust your actions accordingly. Here are the 20 essential email metrics for measuring and optimizing your e-mail marketing efforts. 😎
#1: Deliverability rate
The deliverability rate indicates how many of your sent e-mails actually arrive in your recipients ‘ inboxes (and not in the spam 😬 folder)
A good deliverability rate ensures that your e-mails are received by the people you want to reach. The higher this rate, the more likely you are to be read and generate action.
A deliverability rate of 100% is almost impossible to achieve. 😱 Why?
- Addresses are non-existent or invalid. For example, on a list of 1,000 contacts, perhaps 200 people never received your e-mail. It’s important to monitor this metric to identify if your deliverability is declining. 📉
- Blacklists. Sometimes, even through no fault of your own, you can end up on a blacklist, especially if you’re using a shared IP address instead of a dedicated one. Spam filters on e-mail providers can also block your e-mails if certain wording in your titles or content is perceived as suspicious.🫠
Warning: there’s a difference between an e-mail « sent » and an e-mail that actually arrives in the inbox. It’s most likely sent, but will go straight to the recipient’s junk folder.
That’s why more and more web marketers are now using inbox placement rate (IPR) as a key performance indicator. This enables them to measure precisely how many e-mails actually reach the inbox, rather than ending up in spam. 📨
How is the deliverability rate calculated?
➡️ The calculation: E-mail deliverability rate = (number of e-mails delivered / total number of mailings) x 100.
Example:
– 1,000 e-mails sent.
– 900 are delivered.
Deliverability rate: (900 / 1,000) x 100 = 90%.
👉 Conclusion: You have a few inactive or invalid addresses in your mailing lists. Clean them up! 🧹
How to improve your deliverability rate?
There are a number of best practices for increasing this metric. In France, the average is 95%. If you’re below that, here’s my advice:
- Configure your mailbox so that it never ends up in spam. Here’s a tutorial. 👀
- Avoid spam words like « 100% free », « Urgent! » « You’ve won »… 👾
- Test your mails with tools like Mail tester to find out the deliverability of your emails.📮
#2: Reactivity rate
The reactivity rate combines the open rate and the click rate, and shows you how many people actually interact with your e-mails. A good reactivity rate shows that your e-mails aren’t just being opened, but that they’re really capturing the interest of your subscribers. It will correspond to the number of people who will click on a link you’ve put in your e-mail.🤩
The average for this email metrics is around 15%; below 10%, it’s considered weak. 🥲
How is the reactivity rate calculated?
➡️ The calculation: Reactivity rate = (number of clicks on the link / number of e-mails opened) x 100
Example:
– 1000 e-mails opened.
– 100 people clicked on a link.
Your reactivity rate is therefore (100/1000) x 100 = 10%.
👉 What you need to deduce: Your CTA or link anchor needs to be revised to be more eye-catching.
How to optimize your reactivity rate?
Here are a few tips to help you engage your prospects:
- Segment your list to send the right message to the right person. 🧍♀️
- Test the timing, sending your e-mails when your subscriber are most active. Good timing can make all the difference! ⏰
- Optimize your CTAs(call to action) to make them irresistible 😍.
#3: Email open rates
The open rate represents the percentage of e-mails your recipients open. It’s the first indicator of the effectiveness of your e-mail subject lines. If no one opens your e-mails, everything else is useless! 🥲
In general, a good open rate is between 15% and 25%, depending on the sector.👷🏻♀️
Caution. 🚨 Don’t forget that some people use the preview pane for their e-mail. This can record e-mail openings that are not actually opened.
How is the e-mail open rate calculated?
➡️ Calculation: e-mail open rate (number of e-mail opens / number of e-mails delivered) x100.
Example:
– 1,000 e-mails delivered.
– 300 are opened.
Your open rate is therefore (300 / 1,000) x 100 = 30%.
👉What you need to deduce: Your subject line worked well and caught your recipients’ attention! ✨
What are the best practices for improving open rates?
Here are the best practices for boosting your open rate:
- Learn about your industry and make industry-specific comparisons (some industries, like finance and hospitality, generally have higher rates).👩🏻💻
- Do A/B testing: test only one variable at a time (change the title, change the subject line…).📇
- Find your buyer personas, adapt to your targets and their language. A young target will be more attracted to a funny object, for example. 😎
#4: Click-through rate
The click-through rate measures how many people click on a link in your e-mails. This KPI shows you whether your recipients are interested in the content and ready to find out more. However, you need to dig a little deeper to find out how many people were interested in the offer proposed in the e-mail.🕵🏻♀️
Averaged across all sectors, the average click-through rate is 3%. 🙌🏻
How to calculate the click-through rate?
➡️ Calculation: Click-through rate = (clicks/impressions) x 100.
Impressions are e-mails seen, not necessarily read or clicked. Impressions are e-mails that have appeared in the recipient’s mailbox 📨
Example:
– 1000 emails were sent and received (with acknowledgement of receipt, for example).
– 5 people clicked on the CTA.
Your click-through rate is: (5/1000) x 100 = 0.5%.
👉 What to deduce: Your CTA may have been poorly optimized… 🥲
How to improve your click-through rate?
For each campaign, you need to know not only which links they’re most interested in, but also where to place those links in order to get the maximum number of clicks. To do this, there’s no secret: you’ll need to carry out A/B tests. 😌
➡️ You can also compare buttons with different texts, such as :
- Click here.👈
- Discover the offer.
- Find out more.
- Boost my sales.
- Sign up for free.
- Watch the demo video.
- Be surprised.
- Open my gift. 🎁
And, other CTAs depending on your product or service offering.
Warning. 🚨 Clicking on an unsubscribe link can be considered as a click. This is a bad sign!
#5 : Bounce rate
The Bounce rate corresponds to the percentage of e-mails that could not be delivered. There are two types of rejection you can track:
- Permanent rejection (hard bounce):
Please note that we’re talking here about e-mail addresses that are invalid, deleted or simply don’t exist. These e-mails will never be delivered. It’s crucial to remove these addresses from your contact list immediately . Indeed, if you continue to use them, this can affect your reputation as a sender, which could harm future deliverability. 🚫
- Temporary rejections (soft bounce):
This type of rejection is often caused by a temporary problem, for example, when your recipient’s inbox is full or their mail server has a minor technical hitch. Don’t worry, these e-mails may be delivered once the problem has been resolved 😉
The average email rejection rate across industries is 0.7%. 😎
How to calculate this KPI?
➡️ Calculation: Rejection rate = (total number of e-mails rejected / number of e-mails sent) x 100
Example:
– 85 e-mails rejected.
– 10,000 sent.
Your rejection rate is : 85/ 10 000 x 100 = 0,85 %
👉The conclusion: Your rejection rate is higher than average, which means you may need to sort your lists. 🫠
How can I reduce my rejection rate?
There are a few tricks you can use to keep your rejection rate as low as possible. Here are 3 of them:
- Sort your lists and delete inactive emails.
- Use double opt-in to verify addresses before adding them to your list.
- Analyze your soft bounces; if an address generates several problems, consider removing it from your list after a few attempts. 🚫
Little free hack 😍 we explain in a dedicated article, how to find valid pro email addresses, simply thanks to LinkedIn. 👀
#6: Unsubscribe rate
We never think enough about this email metrics, and yet it’s super important!
You can learn a lot from the unsubscribe rate. For example, it means that people haven’t flagged your e-mails as junk, they’ve taken the time to unsubscribe. 👋🏻
Caution. 🚨 If the unsubscribe process is difficult (requires an email address, a phone code, a form), recipients will more easily report you, because it’s easier for them!
By unsubscribing, they’re indicating that they no longer care about your e-mails, your brand or your offers. They’re leaving your sales tunnel (at least in this way).
Don’t worry, though. It’s not always negative! Remember, unsubscribers don’t want to be on your list and leave voluntarily, which is much better for the long-term health of your offer.✨
So, this cleans up your databases as you go along. It’s normal for there to be unsubscribes, don’t try to aim for 0% on this indicator, an ideal rate is 0.2 to 0.5%.
How is the churn rate calculated?
➡️ Calculation: Churn rate (number of unsubscribes / number of e-mails sent) x 100
Example:
– 1000 emails sent.
– 5 people unsubscribe.
Your churn rate is : (5/ 1000) x 100 = 0,5 %
👉 What to deduce: Nothing alarming, this rate is normal. Just keep an eye on it if it increases too much. 📊
How to reduce churn?
All you need to do is pay attention to a few points to reduce your churn. Here are just a few of them:
- Check trends in your churn rates, especially after making changes(marketing segmentation, model redesign…) If the number of unsubscribes suddenly increases in response to the change, you’ll need to review it.🕵🏻♀️
- Avoid spamming your subscribers.👾
- Offer relevant, engaging content that makes them want to read you.🤓
- Offer different sending options such as frequency or themes.🎨
#7: Conversion rate
Now we come to my favorite emailing kpis! 😍
Boosting conversion rate is one of the main objectives of an email marketing strategy. It’s a metric that calculates the number of people who become customers thanks to your emailing actions. A good conversion rate ranges from 2 to 5%😎
That is, they went beyond a simple click on a CTA, they continued with their purchase.🛍️
You can very well define a conversion rate that’s not directly linked to money brought in.
Let me explain: this rate can be linked to other actions, such as :
- Filling in a form.
- Booking an appointment.
- Download a white paper…
The number of users who clicked on the link and performed the required action is then considered a conversion.🌪️
Did you know? 🧐 Emailing has the highest conversion rate of all other digital marketing methods. It’s about time we took a look 😉
How is the conversion rate calculated?
➡️ The calculation: Conversion rate: (number of conversions / number of people contacted) x100.
Example:
– 1000 people contacted.
– 50 conversions.
Your conversion rate is : (50/1000) x 100 = 5 %
👉 What this means: A conversion rate of 5% is already very good! It shows that your e-mails are engaging.
What are the best practices to adopt?
➡️ If you want to boost your conversion rate, here’s how:
- Add different tracking links for all your campaigns.🔗
- Optimize your landing page, make sure the landing page after the click is clear and corresponds to the desired action.🤩
- Adapt your digital prospecting according to the results, by asking yourself the right questions:
- What types of email work best?
- How can we improve the buying process?
- Why don’t the x% go on to purchase after clicking on the CTA?
Caution. 🚨 It’s not enough to know how many buy, but more importantly how many don’t and why.
If you can identify what’s preventing your targets from taking action, then you can improve your marketing funnel, and therefore, your conversion rate will climb.🧗
#8: Growth rate
Growth rate is an email metrics that depends on the kind of growth you want to measure:
- Sales growth linked to emailing.
- The evolution of sales performance indicators.
- Number of new prospects…
This KPI is useful for assessing whether your efforts are generating progress. Whether you’re measuring the growth of your database, your revenues or another indicator, a good growth rate indicates that you’re on the right track. Conversely, a negative rate can signal that it’s time to adjust your actions to stay competitive. 👀
A rate of 5% to 10% growth per period is generally good for many indicators.
How to track growth rates?
- Identify growth levers: Determine what drives growth in your strategy(lead acquisition, loyaltycampaigns, etc.) 📈
- Test and adapt: Adjust your actions according to the results. If your growth slows, test new approaches to boost it.✨
- Measure regularly : Track your growth indicators over defined periods (monthly, quarterly) to detect positive or negative trends. 📊
#9: Spam complaint rate
The spam complaint rate is the percentage of people who have reported your e-mails as spam. In other words, this is an indicator to be monitored very closely, as a high complaint rate can seriously affect the deliverability of your future e-mails.🫠
Too high a complaint rate will ruin your reputation as a sender with e-mail address providers and ensure that your e-mails end up in spam, even for those who really want to receive them 😬.
I advise you to have one below 0.1%. 😎
How to calculate the complaint rate?
➡️ Calculation: Complaint rate = (number of spam complaints / number of e-mails sent) x 100
Example:
– 1000 emails sent.
– 2 people reported it.
Your complaint rate is : (2/1000) x 100 = 0,2 %
👉 What you need to know: Beware, this rate is starting to climb. If it continues, your e-mails could be automatically blocked.
What are the best practices to adopt?
Don’t panic, if this rate increases slightly, here’s how to reduce it:
- Define an editorial schedule to avoid sending e-mails too close together ⏳
- Make it easy to unsubscribe, so your subscribers don’t mark your emails as junk.👋🏻
- Send relevant, personalized content 🎨
#10 : Email forwarding
The e-mail forwarding rate (also known as « Email Forward Rate ») measures the number of times your recipients share your newsletters with someone else, either by e-mail or via a social network. It’s a good indicator of the virality of your e-mails!
If your subscribers forward your e-mails, that’s a great sign! It means your content is deemed so relevant or interesting that they want to share it with others. It’s a form of indirect recommendation and a great way to reach new people without any extra effort. 😴
A good transfer rate is often quite low, around 0.1% to 0.3%.
How is the transfer rate calculated?
➡️ Calculation: (number of transfers / number of e-mails sent) x 100
Example:
– 1000 mails sent.
– 3 have been forwarded.
Your transfer rate is : (3/1000) x 100 = 0,3 %.
👉 What you deduce: Your content is captivating enough for your subscribers to want to share it with others. 🎉
How can you increase this rate?
There are a few tips to improve this rate and engage your audience even more!
- Encourage sharing: Add a « forward this e-mail » or « share » button to your e-mails to facilitate action.👫
- Create engaging content: For an e-mail to be shared, it must be useful, amusing, or provoke a strong reaction in your readers. Make your e-mails worth the detour! ✨
- Offer a reward: You can encourage forwarding by implementing a promotional strategy such as discounts or exclusive offers for those who share. 🎁
#11: Revenue per subscriber
Revenue per subscriber is one of the emailing KPI’s that tells you how each e-mail in your email campaign is performing.
How can I find out about revenue per subscriber?
➡️ Calculation: Revenue per subscriber = (total revenue generated / total number of subscribers)
Example:
– 2000 € generated.
– 1000 subscribers.
Revenue per subscriber is : (2000/1000) = 2 €.
👉 The bottom line: each subscriber earns you an average of €2. You can now optimize your campaigns to increase this value by proposing personalized offers. 🎯
How to boost revenue per subscriber?
Here are 3 tips to boost your revenue per subscriber:
- Identify the types of people who pay and those who don’t: to refine the target. 🎯
- Add people who have paid in all your campaigns to create a specialized customer segment.👯
- Analyze purchase cycles, identify the times when your subscribers are most likely to buy and program your e-mails accordingly. 📅
#12: E-mail ROI
ROI = Return on Investment. In other words, you don’t just calculate the benefit of emails, but also and above all whether it’s profitable for your business 💸
And that’s where we often get surprises. 😱
You can measure this by taking the revenue you get from the benefits of the campaign minus the amount you spent, dividing by that amount. Emailing doesn’t require a large investment, but it offers the best ROI compared to other digital marketing strategies.👩🏻💻
What’s the ROI formula?
➡️ Calculation: [(revenues – marketing costs) / 100] x 100.
Example:
– 500 € revenue generated.
– 100 € of marketing expenses.
Your ROI is : [(500 – 100) / 100] x 100 = 400 %.
👉 The bottom line: Your campaign is extremely profitable! For every euro you invest, you earn 4.
How can you increase your overall e-mail ROI?
Sometimes there are surprises. Why are there surprises? Simply because few people actually calculate the right marketing cost, but there’s more to it than that. Here are some tips to improve your investment:
- Calculate all your costs : Include not only the cost of the sending tool, but also the time spent designing your campaigns, managing your database, etc.⏰
- Optimize your campaigns continuously: Adjust your offers, segments and CTAs to maximize the revenue generated.📊
- Test different formats : Sometimes changing the design, message or offer can have a considerable impact on your results. Never rely on just one campaign format! 💡
#13: Qualification Rate
The qualification rate is an essential email metric that helps measure the proportion of qualified leads from an email campaign compared to the total number of leads generated.
A qualified lead meets the predefined criteria set by the marketing or sales team, indicating a high likelihood of conversion. 🤑
How do you calculate it?
➡️ Formula : Qualification Rate = (Qualified Leads / Total Leads Generated) × 100
Example:
– You generate 100 leads
– 40 of them are qualified
Your qualification rate would be (40 / 100) × 100 = 40%.
👉 The bottom line: A higher qualification rate means better-targeted campaigns and a greater chance of conversion!
How can you improve your qualification rate?
✅ Proven techniques to optimize your campaigns:
- Precise Segmentation: Ensure you’re targeting contacts most likely to become qualified prospect.
- Personalization: Use specific information about recipients to boost engagement and relevance.✨
- High-Quality Content: Share valuable, relevant content to attract the attention of qualified prospects.
- Clear CTAs: Encourage actions that help qualify leads (e.g., downloading resources, signing up for a webinar).👋🏻
- Data Analysis: Continuously track performance metrics and adjust your strategy accordingly.
- Feedback Loop: Work with your sales team to refine qualification criteria and improve future campaigns.
❌ Why might your qualification rate drop?
A lower qualification rate is often due to vague segmentation, leading to irrelevant messages and a less engaged audience. The lower your qualification rate, the slimmer your chances of converting leads.
#14: Response Rate
The response rate is a key metric that measures the proportion of recipients who respond to your email compared to the total number of emails sent. It’s a direct indicator of how well your campaign generates interactions and engages your audience. 😇
- A response rate of 10% or higher is generally excellent, indicating a highly engaged and responsive audience.
- A response rate of less than 2% is considered low, suggesting issues with relevance, personalization, or unclear CTAs. 🥲
This metric highlights the effectiveness of your content and whether you’re reaching the right audience.
What’s the response rate formula?
➡️ Formula: Response Rate = (Number of Responses / Total Emails Sent) × 100
Example:
– You send 200 emails.
– Receive 30 responses.
Your response rate would be (30 / 200) × 100 = 15%.
👉 The bottom line: A higher response rate means more engagement and interaction with your audience, reflecting a successful email campaign!
How can you improve your email response rate?
✅ Key strategies to boost response rates:
- Catchy Subject Lines: Write compelling and relevant subject lines to encourage opens and interest.🤭
- Clear Questions or Feedback Requests: Ask direct questions or request feedback to prompt responses.
- Send at Optimal Times: Choose the right time, based on recipient habits and time zones, to maximize engagement.⏰
This is an important email metric that you can easily track using tools like Waalaxy! 👽
#15: Opt-in rate
The opt-in rate measures the percentage of visitors who voluntarily choose to subscribe to your email list. 🕹️
This is a crucial email metric as it reveals the effectiveness of your lead generation strategies and the appeal of your offers. 💎
➡️ What is a good opt-in rate?
- A 2% to 5% opt-in rate is generally considered strong, indicating that your lead capture methods are working well.
- An opt-in rate of less than 1% is often seen as poor, suggesting that your forms, offers, or CTAs may not be compelling enough.😌
How is the opt-in rate calculated?
➡️ Formula: Opt-in Rate = (Number of New Subscribers / Total Number of Visitors or Signup Opportunities) × 100
Example :
– 1,000 people visit your site.
– 30 of them subscribe to your newsletter.
Your opt-in rate would be (30 / 1,000) × 100 = 3%.
👉 The bottom line: A higher opt-in rate indicates successful lead capture, while a lower rate points to areas for improvement.
How to increase your opt-in rate ?
- Simple Forms: Keep registration forms short, asking only for essential information to minimize friction.📇
- Pop-ups and Banners: Use attention-grabbing but non-intrusive pop-ups and banners to highlight your sign-up offers.
- Social Proof: Display testimonials or positive reviews to build trust and encourage visitors to subscribe.⭐️
By implementing these strategies, you can effectively optimize your lead capture, ensuring a growing and high-quality subscriber list. 🤩
#16: Social Shares
The social sharing rate measures how often your email content is shared on social media by recipients. This can be a good indicator of engagement, but it’s not always relevant for every campaign. 🧐
It’s important to note that a lack of shares doesn’t mean your email content is poor, as it’s rare for emails to be shared on social networks. However, emails might still be mentioned on platforms like LinkedIn, which could indicate strong engagement. 😍
What’s the social shares rate formula?
➡️ Formula: Social Sharing Rate = (Number of Shares / Total Emails Sent) × 100.
➡️ Or for a more accurate measure: Social Sharing Rate = (Number of Shares / Opened Emails) × 100
Example :
– If you send out 1,000 emails.
– 500 are opened.
– 10 of those are shared on social media.
The social sharing rate would be : (10 / 500) × 100 = 2%.
What can you do to increase your social sharing rate?
✅ Proven techniques:
- Add Social Sharing Buttons: Make it easy for recipients to share your emails by including well-placed social buttons.
- Keep It Simple: Don’t overwhelm your email with too many buttons—focus on your main CTA first!
- Use When Relevant: This metric is most useful when social sharing aligns with your goals, such as if you’re a social media influencer or heavily rely on social engagement.
Tips: Don’t worry if your sharing rate is low. As mentioned, social shares are rare in email marketing, but they can still offer useful insights when they occur.✨
#17: Average Conversion Time
The average conversion time measures the period between when a prospect enters your sales funnel (e.g., subscribing to a newsletter) and when they take the desired action (such as making a purchase or registration). ⏰
This metric helps evaluate how long it typically takes for leads to convert, and it should ideally be as short as possible without sacrificing the quality of conversions.
➡️ What is a good conversion time?
- E-commerce: In fast-paced industries like e-commerce, an optimal conversion time might be just a few days. 🛍️
- B2B or Complex Products: For more complex or high-value products, especially in B2B, conversion times may extend from a few weeks to even months, depending on the buying cycle.
Goal: The aim is to shorten the conversion time while maintaining lead quality. The faster you can guide prospects through the funnel, the quicker you can drive revenue, but it’s crucial not to rush at the expense of conversion quality. ✨
How is the average conversion time calculated?
➡️ Formula: Average Conversion Time = (Total Individual Time for Each Prospect) / (Total Number of Conversions)
Example:
If you have three prospects whose times to conversion were 10, 15, and 20 days,
The average conversion time would be: (10 + 15 + 20) / 3 = 15 days.
👉 The bottom line: Knowing your average conversion time allows you to optimize your funnel and shorten the time it takes to convert leads into customers.
#18: Cost Per Conversion
The Cost per Conversion (CPC) is an email metric that measures how much it costs a company to achieve a conversion (such as a purchase or registration) through an email campaign. 💸
This metric helps assess the financial efficiency of your marketing efforts, providing insight into whether your campaign is generating a positive return on investment (ROI).
✅ How to determine a good or bad CPC:
- A good CPC is one that is less than or equal to the value of each conversion. For instance, if each conversion brings in €100, a CPC of €20 to €50 would leave a healthy profit margin.💰
- A bad CPC exceeds the revenue generated by each conversion. For example, if each conversion generates €100 but costs €120, the campaign is unprofitable and needs strategic adjustments.
How to calculate the cost per conversion?
➡️ Formula: CPC = Total Campaign Cost / Total Number of Conversions.
Example :
– Your campaign costs €1,000.
– Generates 50 conversions.
Your CPC would be: €1,000 / 50 = €20 per conversion.
✅ Why might your CPC increase?
Several factors can drive up conversion costs, including:
- Poor Targeting: If emails are sent to less-qualified prospects, conversion rate may drop, increasing your CPC.
- Irrelevant Content: Content that doesn’t engage or resonate with recipients can lead to lower effectiveness.😌
- External Factors: Increased competition, changes in consumer behavior, or rising advertising costs can also drive up costs.
- Technical Issues: Problems like poor deliverability or broken links can reduce engagement and drive up CPC.⛓️💥
#19: Retention Rate
The retention rate is a key email metric that measures your ability to keep subscribers engaged over a given period. It tracks the percentage of recipients who continue to open and interact with your emails. 🤝
This indicator is crucial for evaluating subscriber loyalty and the long-term effectiveness of your email campaign.
✅ What is a good or bad retention rate?
- A retention rate of 80% or more is considered excellent, reflecting strong engagement and customer loyalty. ✨
- A retention rate of less than 50% suggests issues such as content irrelevance, poor timing, or overwhelming frequency, leading to disengagement or unsubscribes.
How to calculate the retention rate?
➡️ Formula: Retention Rate = (Number of Active Recipients at End of Period / Number of Active Recipients at Start of Period) × 100
Example:
– You start a campaign with 500 active subscribers.
– You have 450 still engaged at the end of the period.
The retention rate would be: (450 / 500) × 100 = 90%.
👉 The bottom line: A high retention rate shows strong loyalty and commitment from your audience, ensuring long-term success.
How to maintain a high retention rate ?
- Provide Valuable Content: Ensure your content meets your subscriber’ needs and interests.🤓
- Optimal Frequency: Send emails at the right frequency to avoid overwhelming or neglecting your subscribers.
- Loyalty Programs: Offer incentives or loyalty programs to keep subscribers engaged.🥰
#20: Average read time
The average read time measures how long recipients spend reading your emails. It provides valuable insights into your audience’s engagement and interest in the content of your messages. 📚
✅ What’s a good, bad, or too long read time?
- Good Read Time: Between 15 seconds and 1 minute is generally considered good, meaning subscribers are engaged and reading your email in full.😍
- Bad Read Time: Less than 10 seconds suggests that recipients may find the content irrelevant or unengaging.
- Too Long: More than 2 minutes may indicate that your email is too detailed, dense, or poorly structured, potentially overwhelming readers and causing them to lose interest.😩
How to calculate the Average read time?
➡️ Formula: Average Read Time = Total Read Time of All Emails / Total Number of Open Emails
Example:
If the total read time for 100 opened emails is 1,500 seconds.
The average read time would be: 1,500 seconds / 100 emails = 15 seconds per email.
👉 The bottom line: Knowing the average read time allows you to assess how engaged your subscribers are and whether your content holds their attention.
How to improve a good average read time?
- Attractive Design: Use a clean, visually appealing design with quality images to make the email enjoyable to read.
- Clear Titles and Subtitles: Guide your readers through the content with compelling headlines and subheadings.🥸
- Appropriate Length: Ensure your emails are informative yet concise, balancing detail with readability to keep attention.
Let’s have a recap: which KPIs to measure in the emailing process?
I’d like to conclude this article with a recap of all the email metrics. 🤩
Frequently asked questions
Which tool should I use to launch my email marketing campaigns?
The tool we suggest, and the one we’ve used to launch hundreds of successful campaigns, is Waalaxy.
You can :
- Find email addresses and create a database with the Email Finder.
- Send high-volume emails with sophisticated templates. 🧅
- Easily develop your strategy with multichannel actions.
- Track email metrics easily with the integrated CRM !
Want to know how it works? Well then, what are you waiting for, it’s free 😉
What are the 5 key performance indicators in digital marketing?
➡️ The five key indicators of your digital strategy are :
- Deliverability rate.
- Click-through rate.
- Open rate.
- Conversion rate .
- Return on investment.
These are the five most important indicators to keep a close eye on. Of course, don’t forget to check the growth rate and keep a close eye on your A/B tests. 👀
Now you know all about emailing KPIs! 🚀