In this article, we will see how the BCG Matrix works and what are the steps to make your own marketing strategy. 🤓 We will also see, 5 examples of use in the business environment to better illustrate these ideas.
Let’s go! 🚀
What is a BCG Matrix?
First, a little history to understand better the BCG Matrix definition. 🧐
It is a strategic analysis tool created by employees of the “Boston Consulting Group” in the United States: Alan Zakon first sketched it and then, together with his colleagues, he refined his theory. The founder of BCG, Bruce D. Henderson, popularized the concept in an essay entitled “The Product Portfolio” in 1970. 💼
I admit it’s a bit dated, 😅 but this matrix is still a typical marketing tool since it’s very simple to use and understand for your new business.
It allows professionals to better understand the positioning of their product portfolio, based on the target market growth (vertical axis from – to +) and the company’s relative to market share (horizontal axis from + to -).
Here is an infographic to show you what the BCG matrix looks like in a general way. 👇🏼
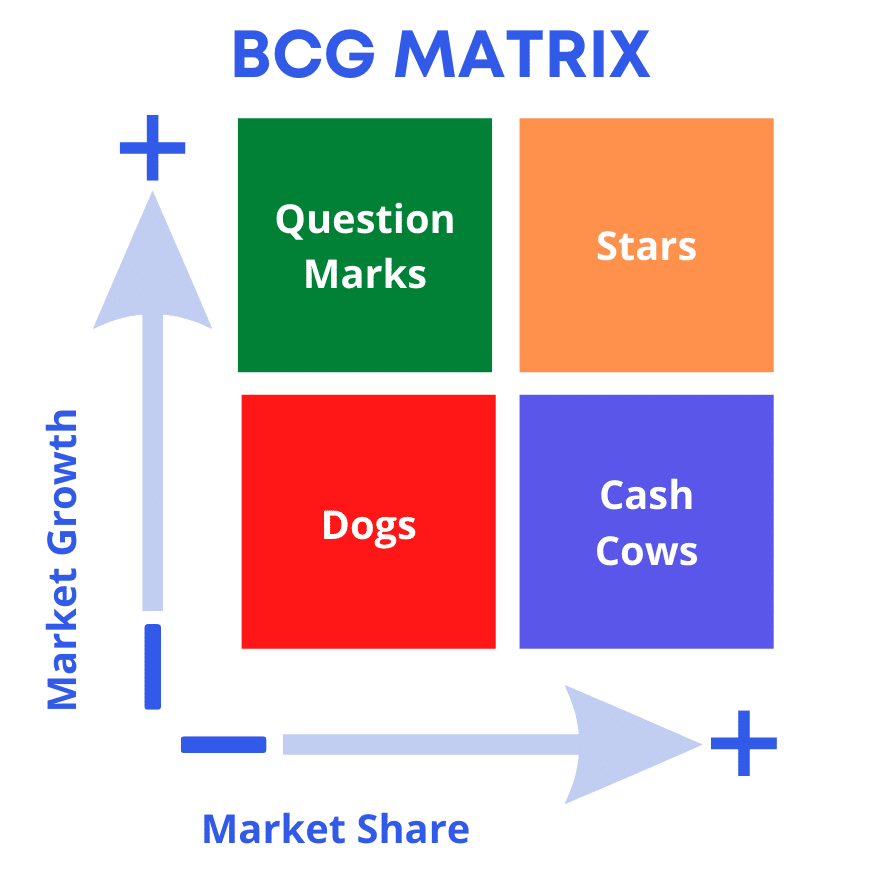
Thus, the attractiveness of the market and the competitive position of each company’s product-development or marketing activities, are demonstrated.
This allows to categorize the products of Strategic Porter Five Forces analysis in 4 categories.
- Stars.
- Cash Cows.
- Question Marks.
- Dogs.
Define strategic approach for business-plan cannot rely solely on the use of the BCG matrix. It will need to be complemented by other analysis tools, such as the SWOT matrix, for example.
👌 In addition, other criteria can be incorporated into this analysis, such as placing a product between two categories of the matrix, as it may evolve according to supply and demand.
This matrix gives an overview, but it is not the only help for intake of decisions. BCG matrices are divided into 4 categories: 👇
1) BCG Matrix Star Products
“Star” products are positioned in growth markets with a dominant market share. They are the flagship products currently of a company. They contribute to the growth of the company.
However, for this category of products, you have to differentiate yourself from competitors and that requires significant investments, especially in communication and target market. 🎯
2) BCG Matrix Cash Cow Products:
“Cash cow” products are positioned in slow-growth markets, but have a dominant position, i.e., they have a high market share. 💪 These products do not require a large investment compared to the margins earned by the company, and these products ensure the financial strength of the company.
It is often the “Star” product that allowed the company to grow before. 💰 Therefore, they must be preserved unless they become “Dogs”.
3) BCG Matrix Question mark Products:
“Question mark” products have a high competitive strategy but generate little profit. 🤷 They are represented by products with a low share from the market.
Either they will become “Star” products (because of growing market) or they will become “Dogs” (since not enough profit).
4) BCG Matrix Dog products
They represent a small market share in a slow-moving market. 👎 They are called “dogs” because they add no value proposition to the company’s growth and profits.
In fact, they are products that do not add profitability (anymore).

BCG Matrix : 5 Examples
Follow me to discover the 5 BCG matrix examples of very famous brands. 🤑 And this way, you’ll get a more concrete idea of how to use it for your business models. ⚡
Example 1: BCG Matrix Apple
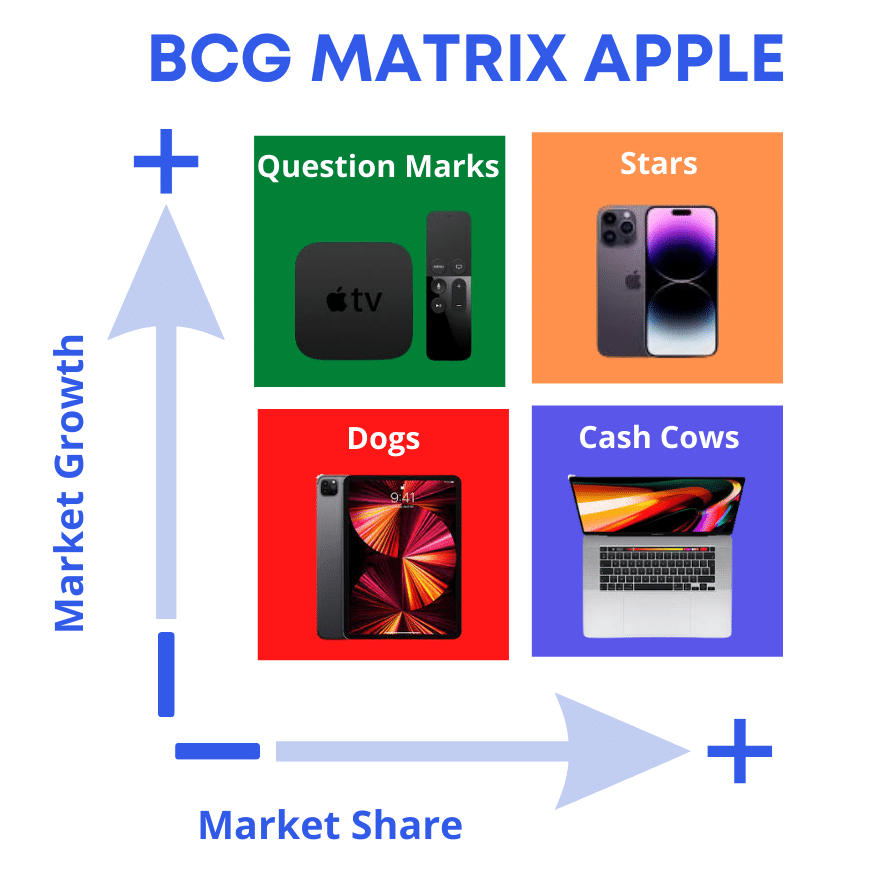
Here is the strategic analysis of Apple products: 👇
- Stars – iPhone: from Apple’s beginning, the iPhone has been THE flagship product! Its demand is very high, and its growth is uncertain, as there are more and more competitors.
- Cash cows – MacBook: this laptop is one of the market-leaders today. It is produced in large quantities and its quality is recognized, hence its high selling price.
- Question marks – Apple TV : this is a new product that has a low profitability for the moment because it is not up-to-date with its competitors like Amazon “Fire stick”/Alexa, etc. Nevertheless, it has a strong growth potential.
- Dogs – iPad: has become a niche product for graphic designers and businesses. But it’s not the novelty it was a few years ago, so growth is low.
Example 2: BCG Matrix Example Samsung
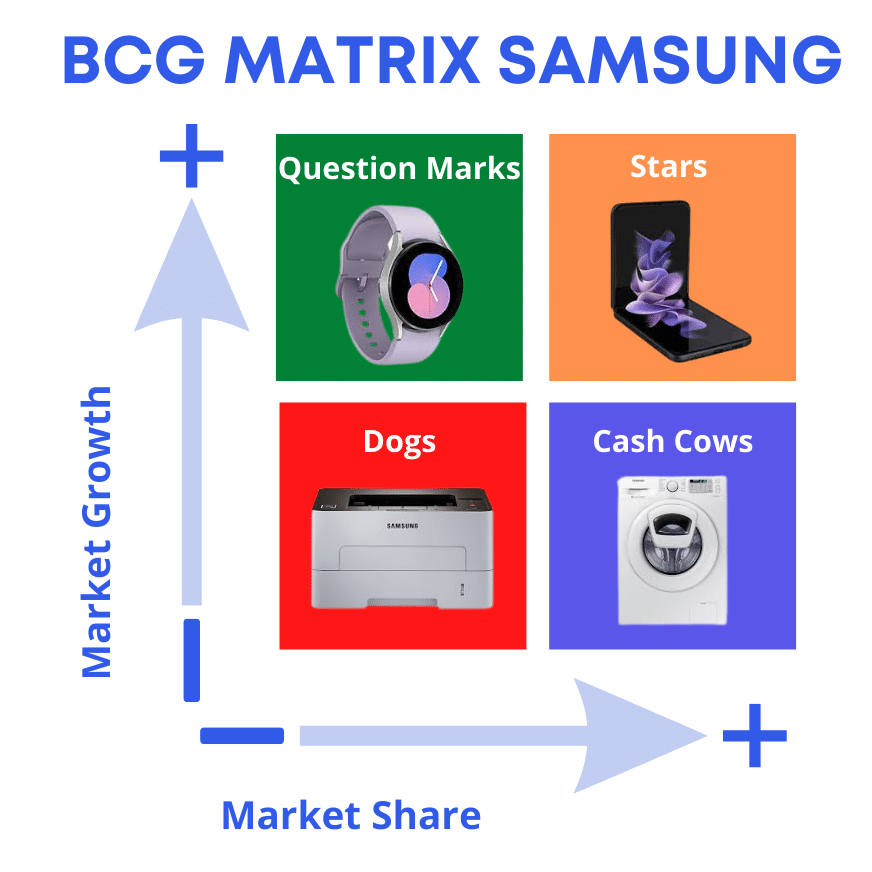
Here is the strategic analysis of Samsung products: 👇
- Stars – “Smartphones”: Galaxy smartphones are Samsung’s star product. Relative market share and growth are high. This is where Samsung should invest in further increased profits.
- Cash Cows – Appliances: Samsung is known for its high-quality appliances and has a high relative market share. The market for these is not growing much, as demand is constant. So the skimming business strategy should be applied here: Samsung should skim as much profit as possible from this area without making heavy investments.
- Question marks – “Smartwatches”: Samsung Smartwatches are currently a question mark. Market share is low, but the market is growing very strongly. Samsung must decide to go on the offensive or leave the market. An offensive here could be to sell the product at a lower price or to initiate marketing measures to increase sales.
- Dogs – Printers: for printers, the relative market share and market growth are low. Conventional printers are not expected to become more important in the future. That is why Samsung has already successfully implemented the corporate divestment strategy here and sold the printer division to HP.
Example 3: BCG Growth Share Matrix Google
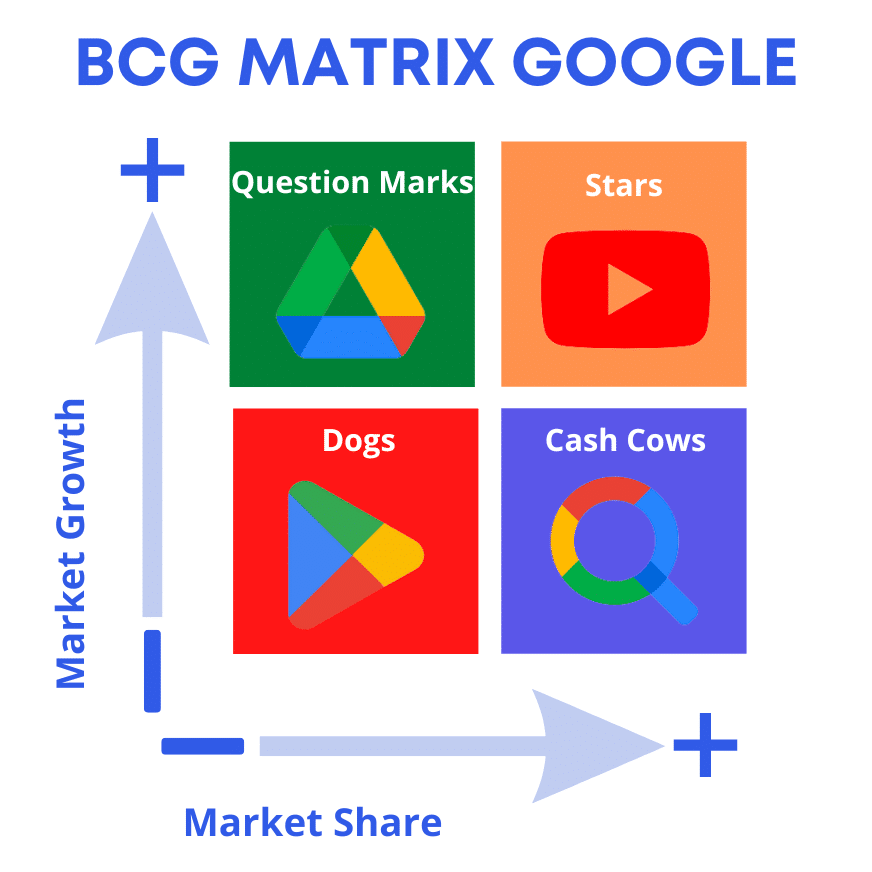
Here is the strategic analysis of Google products: 👇
- Stars – YouTube : YouTube is also a flagship product. Did you know that over 500 hours of content is uploaded to YouTube every minute? Growth and expansion is touching the sky for this one.
- Cash cows – “Google searh & Ads“: And as far as the Google search engine is concerned, about 70% of the world’s population uses it. Thus, making it dominant in the relative market share. Available on both desktop computers and mobile devices, it is the browser of choice for many people: on all platforms.
- Question marks – “Drive & Docs”: Google Drive and Docs are one example. The demand for data storage and protection has increased the market for cloud storage. Google Drive and Docs have potential and high market growth, but face less money back due to the high market share of their competitors.
- Dogs – “Google Play”: This product was not a total failure, in terms of ideas. Google Video was launched in late January 2005 and 22 months later Google bought YouTube for $1.65 billion. And now you find all the videos on YouTube, hence the failure of Google Play video player to generate revenue.
Example 4 : what is the BCG matrix of Coca-Cola?
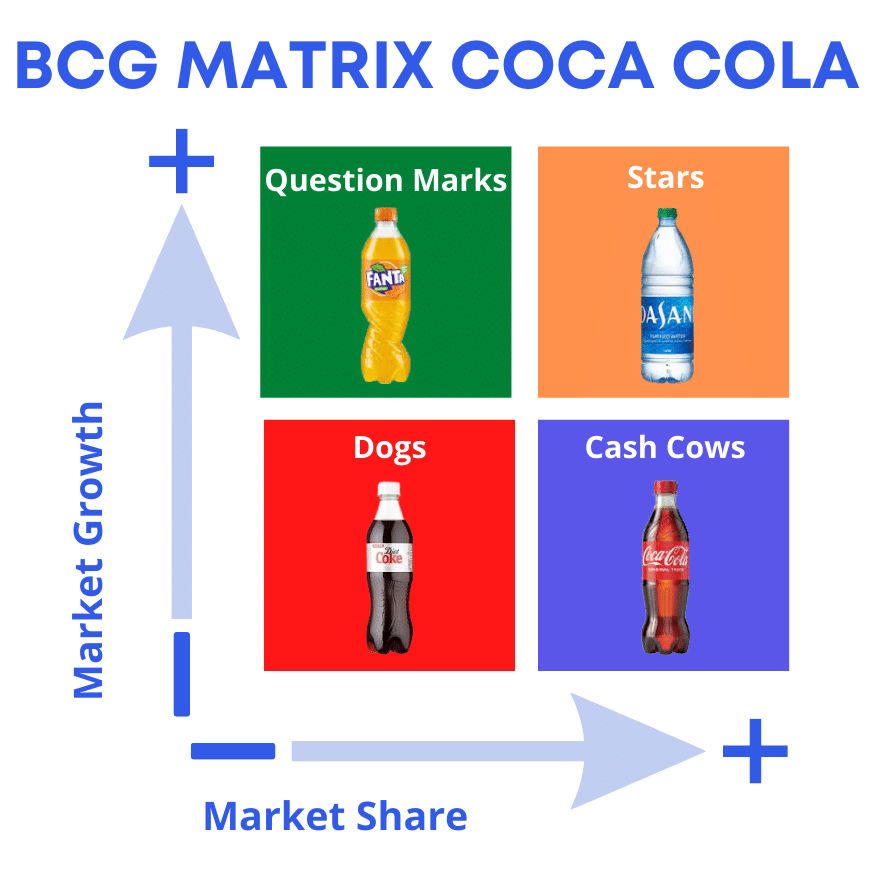
Here is the strategic analysis of “Coca-Cola Company” products: 👇
- Stars – “Dasani”: Coca-Cola’s Dasani water falls into this category because bottled water is becoming an ever-changing product life cycle in the international market. Coca-Cola has the opportunity to invest in marketing and advertising in Dasani products to ensure higher market share and growth.
- Cash cows – “Coca-Cola”: The coca-cola brand has been in the market for years and has gained a leading position in the market in the carbonated soft drink market. It is also an important revenue generating product for the company.
- Question marks – “Fanta”, other beverages: There is a huge potential for these products in the market due to the increasing health consciousness of the customers; which suggests that Coca-Cola should either discontinue these products or invest in advertising, improve product quality and other features to ensure greater customer appeal.
- Dogs – “Diet Coke”: Coca-Cola could abandon this product as it is the least profitable product for the company with a very low market share, since there is already the “Coca-cola Zero” which is greatly preferred.
Example 5: The BCG Matrix Nestlé
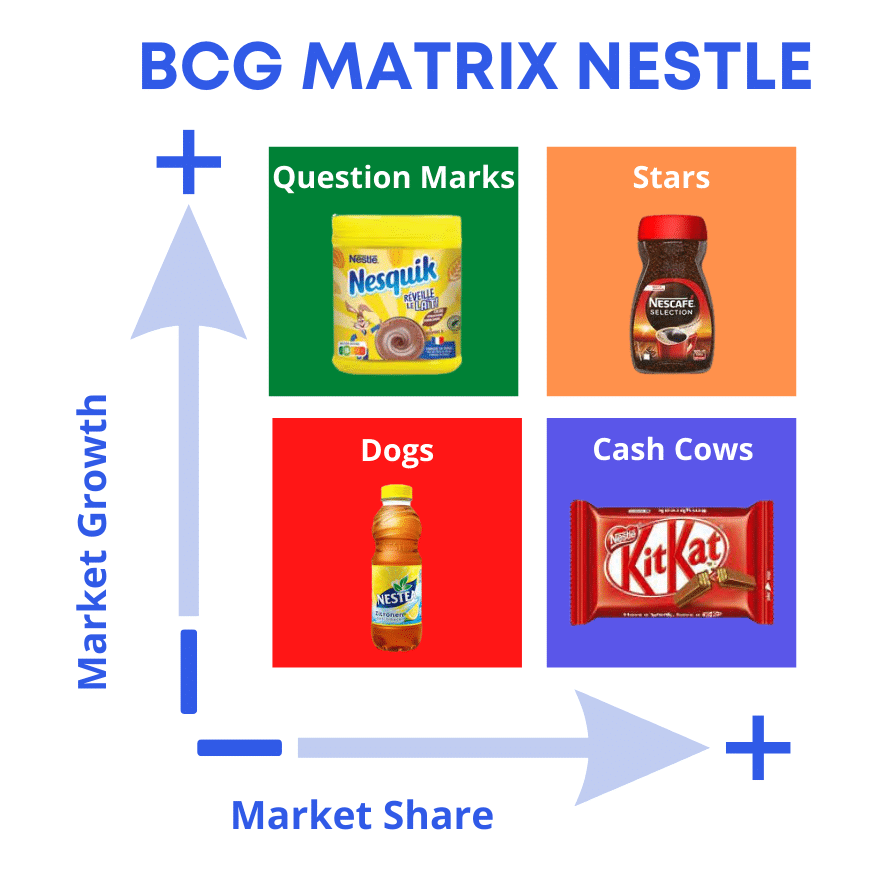
Here is the strategic analysis of Nestlé products: 👇
- Stars – Nescafé: These products have the potential to generate a better return on investment later on. Although it may require heavy investment to make the Nescafé brand more visible in this market, they could soon become cash cow products.
- Cash cows – KitKat: These products have high customer loyalty (especially in Asia). They require very little investment. In fact, they are already available in every nook and cranny. And are loved by most of us.
- Question marks – Nesquik: Some of Nestlé’s milk products are Dilemma products. Since this area requires more investment because it is in the strategic development process. And it’s also a high-risk decision to invest in it.
- Dogs – Nestea, others: Products in this category do not provide significant benefits. Thus, future investments are considered wasteful by the company, they may instead become products in the “Dilemma” or “Star” categories in the future.
How to apply the BCG Matrix to marketing in 5 Easy Steps?
Every company differs in how they handle their BCG matrix. 🤔
In most cases, here are the 5 steps commonly followed by companies to create it: 👇
#1 Choose the strategic business unit or product-market fit
The first thing you need to identify is the specific item you want to analyze. This can be a product, separate brands, business units or a company. The choice of unit will impact the analyzing.
#2 Define the market
Failure to accurately define the market can lead to misclassification of products. To better understand the business portfolio’s position, prior research is essential to define the market accordingly.
#3 Calculating relative market share
Market share refers to the total market served by a company, measured either in unit volume or revenue. Relative market share for your business is used in this particular matrix to compare product sales with the sales of major competitors of a similar product.
#4 Identify the market growth rate
You can immediately find the industry’s growth rates from sources available online. It can also be calculated by identifying the average revenue growth of leading companies.
#5 Draw the marks on the BCG matrix template
After all the calculations and evaluations, you can now map the brands on your matrix. There are several online tools you can use as a BCG matrix template, or you can create your matrix from scratch, with a tool like Canva, for example.
The competitive advantage of online tools is that you can use colors, stickers, and images to highlight key elements of the diagram.
Next, we’ll look at the relative market share calculation in more detail! 🔍

How to do the Market Share Calculation of the BCG Matrix?
💡 To find out your relative market share of your business, you can use 2 formulas:
Relative market share = 100 * share of the market of your company / share of the market of your largest competitor.
Or you can use the formula below:
Relative market share = sales of your company / sales of your main competitors.
👉 For example, if you sell shoes and your total sales for a quarter are $100,000 and during the same period the total industry sales are $1,000,000, your market share is 10%.
The exact formula would be : 100,000 USD / 1,000,000 USD = 0.10×100 = 10% market share.
| Total sales | Global sales | Share % |
| 100,000 | 1,000,000 | 10 |
This metric will give you an overall understanding of your company’s position in industry attractiveness. However, try to compare yourself to direct competitors. Otherwise, this will not be a useful metric to track. 🙈
Conclusion BCG Matrix Products
In conclusion, the BCG matrix is built by placing products on 2 axes: market growth rates and relative market share (your market share / competitor’s market share). 👀
Therefore, the BCG matrix is an easy and straightforward model. 🏹 Ideally, the results should be crossed with other matrices such as SWOT (Strengths and Weaknesses, Opportunities and Threats), PESTEL, etc.
FAQ: BCG Growth-Share Matrix
What are the 4 quadrants of the BCG matrix?
A BCG Matrix is a useful tool for marketing management of portfolio for B2B or B2C companies. It is based on the attractiveness and the competitiveness of a company on the market. 🛍️
This positions each product in the BCG portfolio matrix on two axes : market growth and relative market share.
🍰 The chart therefore offers 4 categories to classify the products: Stars, Cash Cows, Question Marks and Dogs. This model allows you to decide what steps to take to better to market a particular product.
What is BCG Matrix explain with example?
The strategic objective of the BCG matrix is to be able to know what the competitive advantages are of certain products. Furthermore, it is a simple-to-understand and effective tool. 💥
Moreover, the matrix allows you to analyze your products according to their growth and relative market share. 💡
This is then a way to visualize the potential of each product in your portfolio analysis. After all, it is a tool to help at decision-making to arbitrate future investments and determine the next marketing strategy efforts.
How do you use the BCG matrix?
The BCG matrix can be used for business in the following cases:
- When you develop your global prospecting plan to define your company’s priorities and budgets by products. ⚖️
- If you want to analyze which business strategies work best before launching a new product. Then you need to do market research first, to know if your investment will pay off at some point. 📈
What is a Cash Cow product in marketing according to the BCG model?
A cash cow product is a product in the portfolio with a high market share in low growth markets. 🔥 With this product, your investment has already been amortized, so you can make a good profit-margin.
A high cash-flow product is a product that provides “working capital” at a certain point in time. 🚩
Great! Now you’ll be a pro of the BCG Matrix. 💯