Performance indicators are a very important part of your prospecting strategy . They enable you to monitor your results, and at the same time, to know whether the strategy you’ve put in place is working, or whether it needs to be reviewed. 👀
This article will detail the different indicators available on Waalaxy. 📈

Indicators linked to LinkedIn actions
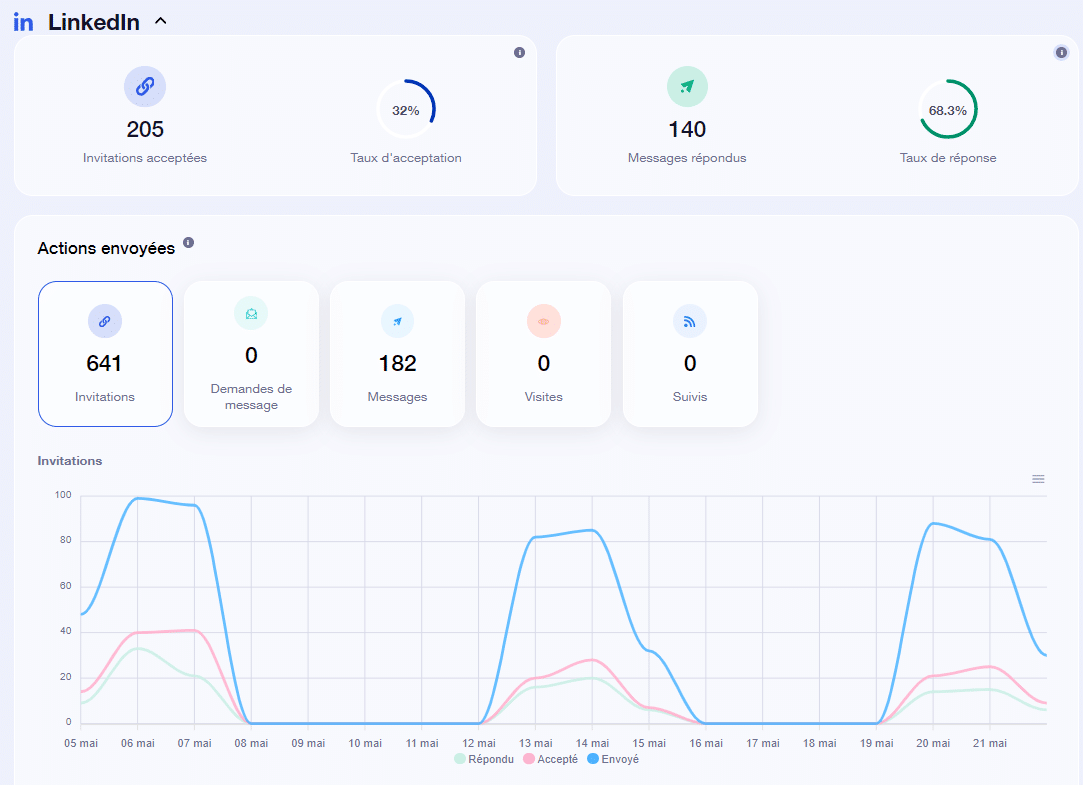
Here we’re going to talk about performance indicators linked to sending LinkedIn actions, i.e., invitations, messages. These indicators are displayed both on your home page (dashboard common to all campaigns) :
Or in the statistics tab for each campaign (specific to that campaign):

On your dashboards, you’ll find :
- The number of actions sent by Waalaxy, for each type of action.
- Acceptance rate: this is the percentage of people who have accepted your connection request, out of the number of connection requests sent.
- Response rate: this corresponds to the number of responses to messages out of the total number of messages sent. This includes replies to LinkedIn messages, replies to connection notes and replies to message requests.
By hovering the mouse over the graph, you’ll have access to the details of what was sent date by date. 👌
Email-related indicators
Now let’s talk about performance indicators related to sending emails. These indicators will only be visible to our Business users, as only this subscription gives you access to the email sending functionality. 📩
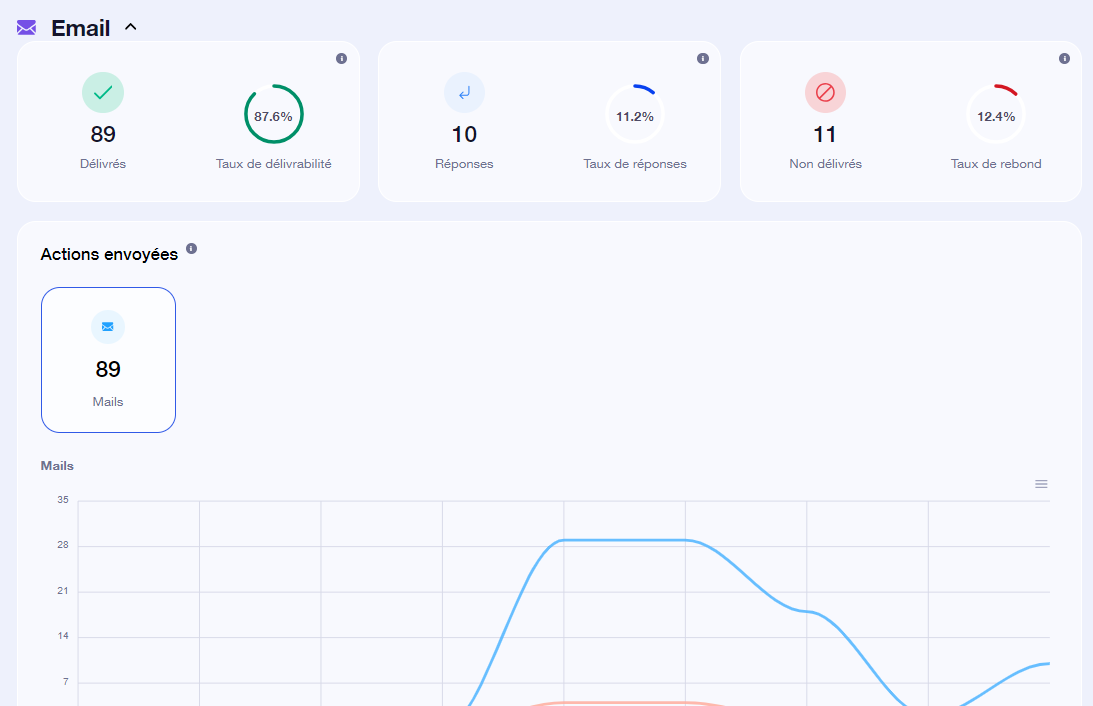
These dashboards are also visible at the bottom of the home page:
And in the statistics tab of each campaign:
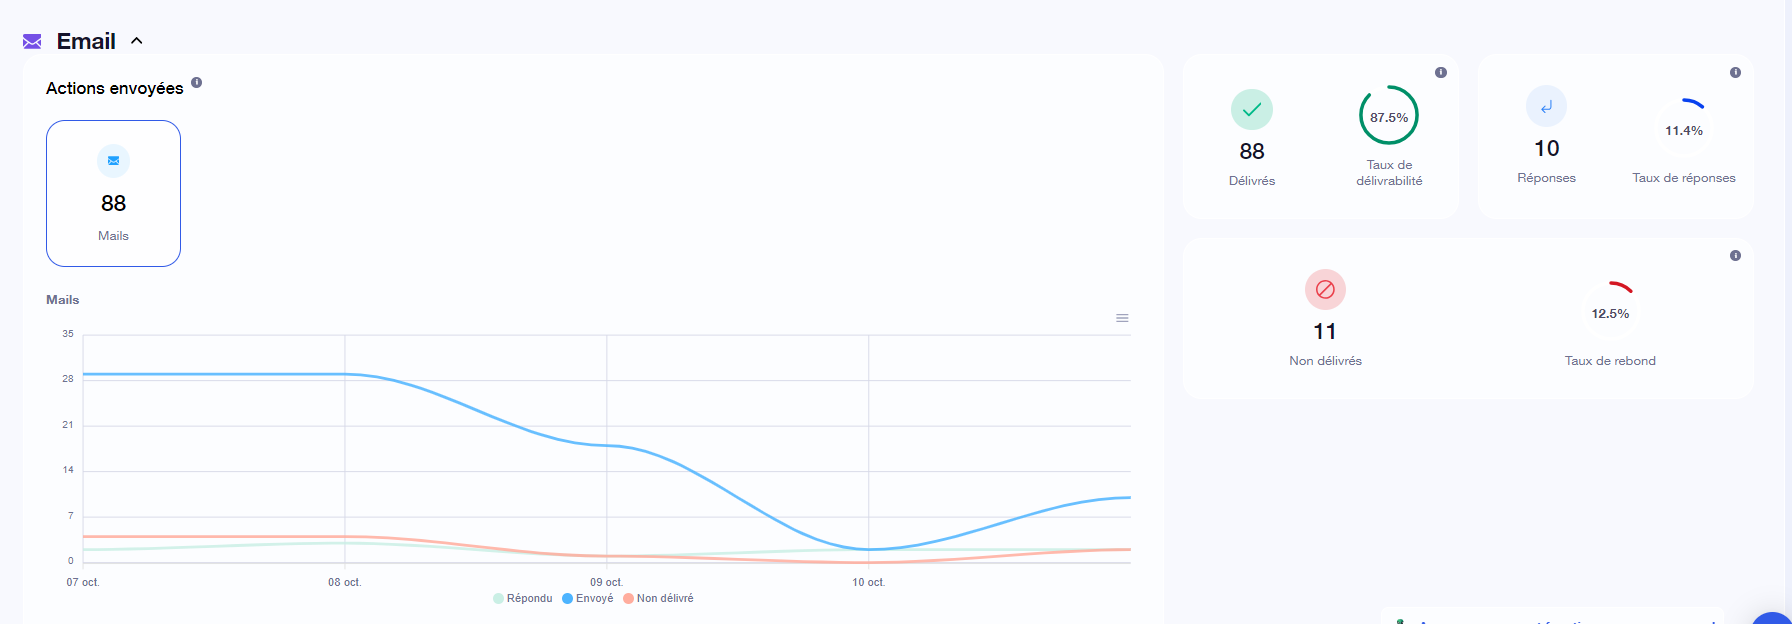
Here you’ll find :
- Delivered emails: these correspond to emails that have been delivered correctly to your recipient’s main prospecting mailbox.
- Undelivered emails: these correspond to mailings that are considered spam or have been refused by the prospect’s supplier (=bounced).
- Response rate: this takes into account the number of emails that have received a response from the prospect, out of the total number of emails sent.
Roll your mouse over the graph to see the details of what was sent, date by date. 👌
💡Response rates to LinkedIn messages and emails also appear right at the top of your home page. Click on them to go straight to the full LinkedIn actions, or emails, dashboard. 😎

Indicators linked to the Email Finder
If you’re running a campaign with an Email Finder step, you’ll have access to indicators specific to it, both on the home page (all campaigns combined), on the right :
And in each campaign, in the Statistics tab:
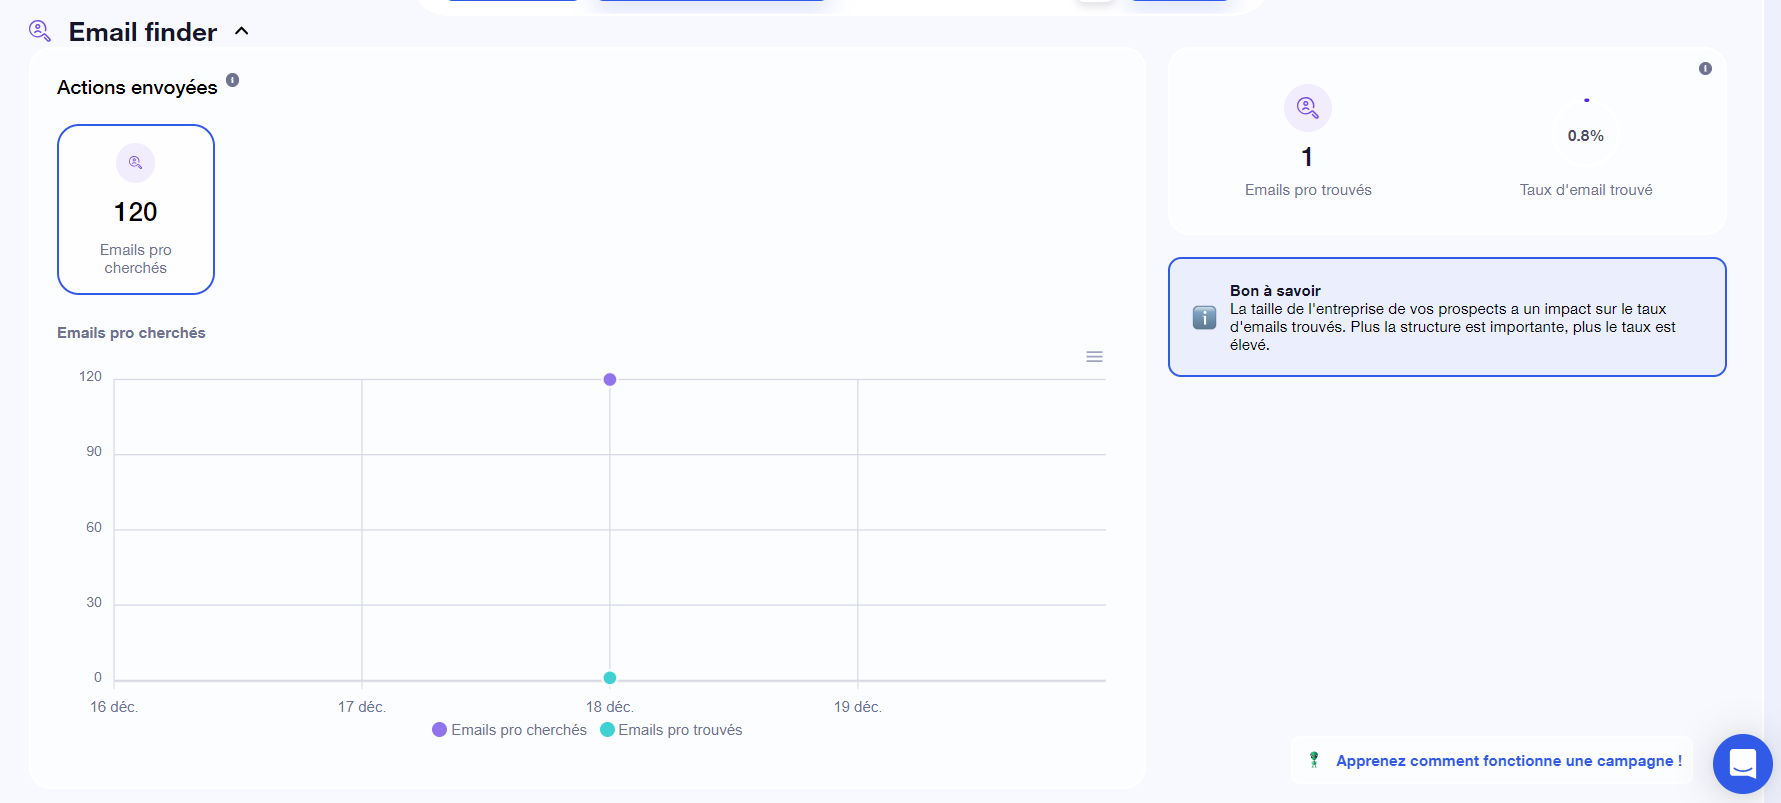
The indicators available are :
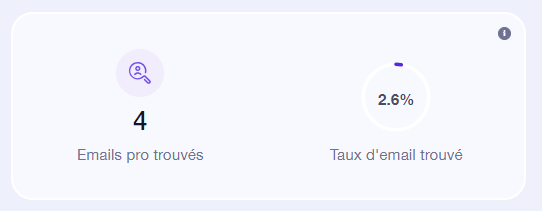
- The number of pro emails searched, i.e. all the prospects for whom we have searched for pro email addresses.
- The number of pro emails found , i.e. all prospects for whom we have searched for pro email addresses.
- The rate of emails found, which corresponds to the number of pro emails found out of the number of pro emails searched for.
Indicators for your LinkedIn profile
On your home page, in the top right-hand corner, under your profile photo, you can see your number of LinkedIn connections, the number of pending invitations and the number of views on your profile.
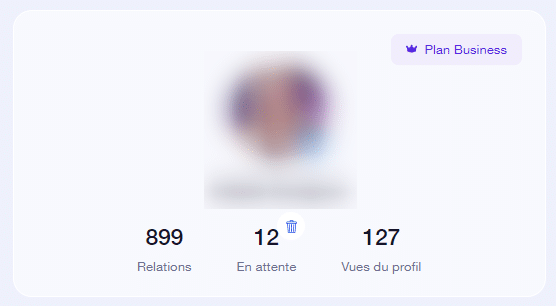
💡Click on the trash 🗑️ to delete your pending invitations.
Prospecting indicators
Still on the right-hand side of your home page, you’ll be able to see the number of active Waalaxy campaigns, the number of queued actions and the status of your account/actions (Active, Inactive, Pending) :
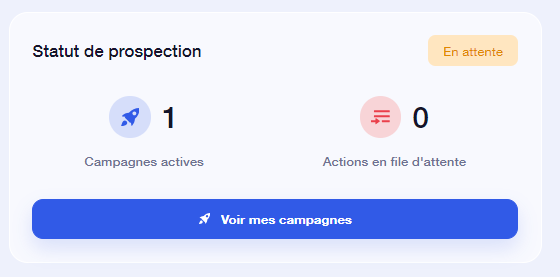
Campaign status indicators
Now let’s go to the “Prospects” tab of your campaign, then to “Details”:
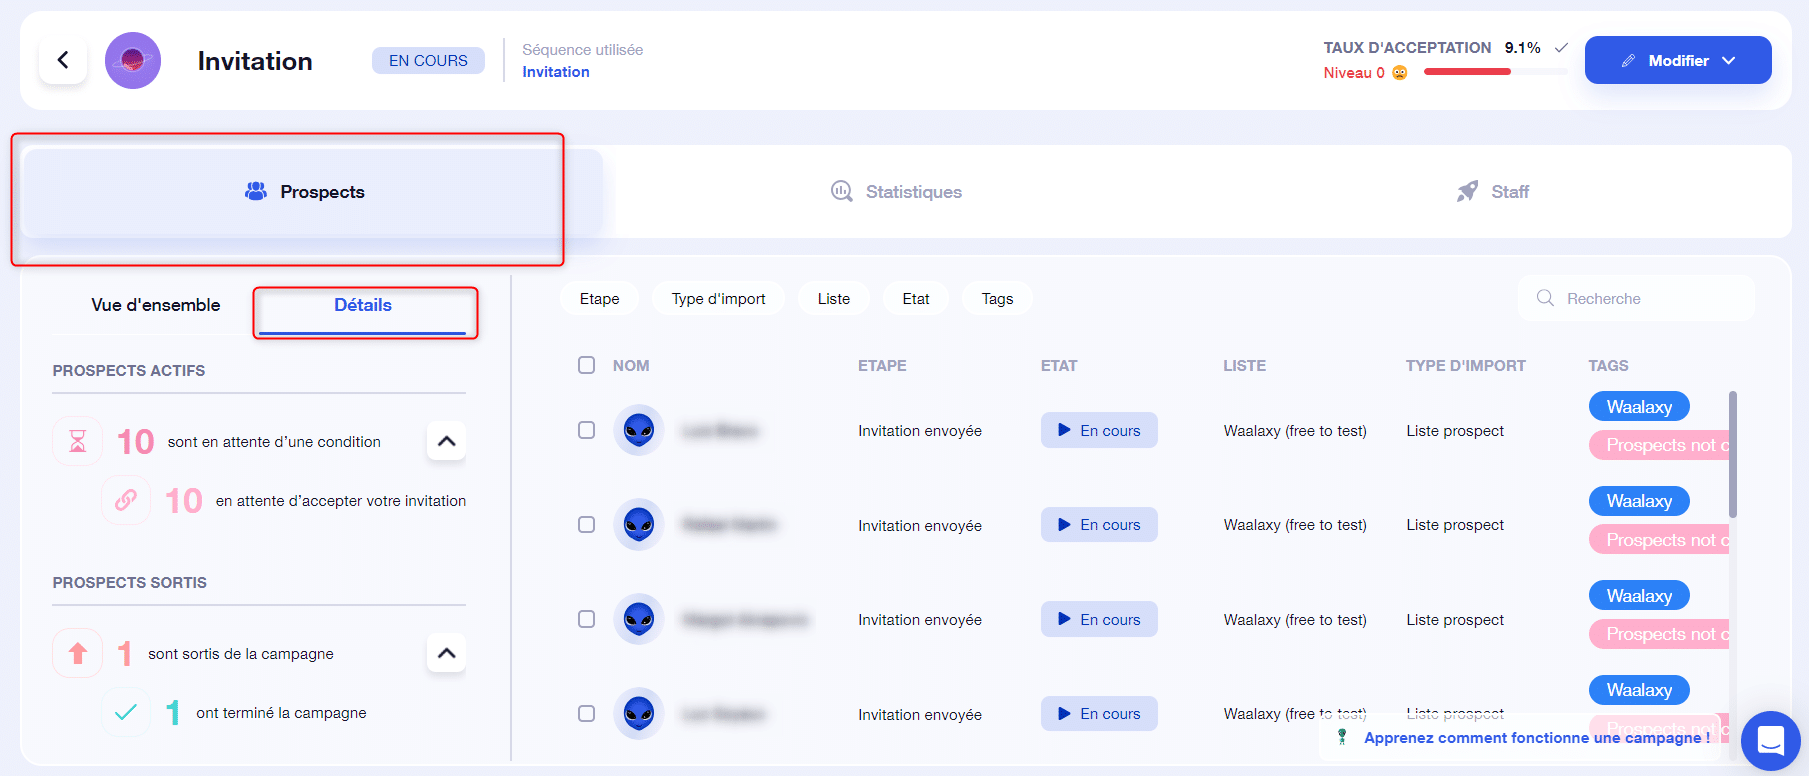
Here you’ll find information on the progress of your campaign: how many prospects are active, how many have completed the campaign, how many are waiting to accept an invitation, etc., depending on your campaign.
To understand how a campaign works, take a look at ➡️ How a campaign works!
Frequently asked questions
Where can I find my dashboards on Waalaxy?
You can find a general dashboard on the Waalaxy home page, giving you indicators for all campaigns.
You can also find a campaign dashboard that lets you track the status of your current prospecting campaign.
Is it possible to export a dashboard?
You can export your dashboards to a CSV file:

What are acceptance and response rates?
The acceptance rate gives a percentage of the number of people who have accepted your connection request, out of the number of connection requests sent.
The response rate corresponds to the number of replies to messages out of the total number of messages sent. This includes replies to LinkedIn messages, replies to connection notes and replies to message requests.
Can I track the click-through rate on a link?
No 🙁. If you want to do this, you can use tools like Bitly or Uclic. Both of these tools have free versions that let you do quite a bit already.
Do I have access to email open rates?
No, you don’t! The only indicators relating to emails are delivered, undelivered and response rate.
Conclusion
As we often say, it’s really important to have a prospecting strategy in place to turn your prospects into leads, and to get the most out of them.
The second important thing to take into account is obviously the performance indicators that enable you to track and analyze the results of your automation campaigns. This is how you’ll know whether your strategy is working, or whether it needs a little more work.
Let’s get analyzing! 🤓


